
(Check out our other baseball trivia posts here.)
Like most serious collectors who grew up in 1980s or before, I also developed a serious love of statistics alongside my fervor 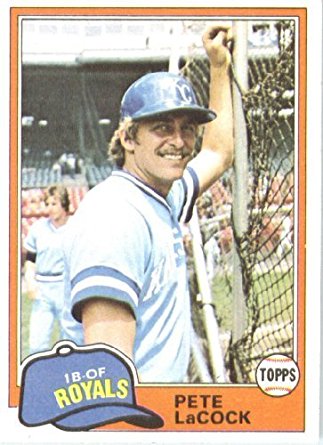 for baseball cards.
While I have never delved deep into the development of new stats or even claim to understand all of the advanced metrics available these days, I am a big believer in the value of composite player “scores” like WAR and ERA+
One of the very first attempts to move beyond rudimentary counting stats and summarize a player’s value in one simple number was OPS, or On-Base Percentage Plus Slugging Percentage.
It’s a stat that I first remember reading about in the 1990s, and it’s proven to be an easy, if coarse, tool for making quick evaluations — for fantasy teams, projecting how good a player might be given his age, etc.
But OPS is not something we would have found on the baseball cards of our youth … or is it?
In a recent article, I ran down the history of saves on baseball cards, which prompted reader Dodgers88 to reply on Twitter:
https://twitter.com/tqsundstrom/status/884167142391808006
I have to admit that when I first saw this comment, I thought it would be an easy task.
I was pretty sure that was one of the stats that had been on baseball cards, like, forever.
Then I realized that Dodgers88 said “OPS” and not “OBP.”
Then I looked at a few cards from the 1980s.
Then … well, I grabbed some coffee and started searching.
So which baseball card was the first to feature OPS?
Read on to find out, but let’s start with a brief bit of history.
(And thanks to Dodgers88 for this post idea!)
History of OPS
As mentioned above, OPS consists of two components, the first being on-base percentage:
On-Base Percentage (OBP) = (hits + walks + hit-by-pitch)/(at-bats + walks + hit-by-pitch + sacrifice flies)
According to MLB.com, OBP was developed by executive Branch Rickey in the 1940s or 1950s as he built the Brooklyn Dodgers into a National League powerhouse.
The second component of OPS is slugging percentage:
Slugging Percentage (SLG) = [numSingles + 2*numDoubles + 3*numTriples + 4*numHomeRuns]/AB
John Thorn, the official historian for Major League Baseball, tells us that, by the time SLG was adopted as an official MLB statistic in 1923, it had already been around in some form since the 1800s.
Thorn himself was one of the early proponents of OPS through the excellent book he co-authored with Pete Palmer in 1984, The Hidden Game of Baseball.
While the idea of simply adding two averages together to arrive at a decidedly more valuable metric was fairly revolutionary, you can see from the formulas that the building blocks of OPS are as basic as they can be.
Thus, in our search for the first baseball card to feature OPS, it makes sense to start at (or at least near) the beginning of the modern era.
Do-It-Yourself Slugging Percentage
In 1952, Topps showed the first signs of a cardboard revolution by including a dedicated stats box on each card, showcasing games, at-bats, runs, hits, home runs, RBI, and batting average.
Beginning in 1953, though, Topps gave collectors all the pieces they needed to calculate slugging percentage if they were so inclined.

That was the first year baseball cards showed extra-base hits as part of Topps’ growing stats block, giving collectors doubles and triples in addition to homers, hits, and at-bats. It wouldn’t have been hard for anyone who was familiar with SLG to derive the formula they needed from the available card-back information:
SLG = [2*numDoubles + 3*numTriples + 4*numHomeRuns + (numHits – numDoubles – numTriples – numHomeRuns)]/AB
Sure, it’s a bit ugly, but it could be done.
Not much changed in terms of the variety of statistics offered by Topps baseball cards as the years ticked by, though full season-by-season stats did appear for the first time in 1957.
Then, out of the blue in 1971, Topps veered dangerously close to Sabermetrics territory. Scan your eyes across the stat line on the back of a hitter’s card from the “Black Beauties” set and you’ll find something very interesting nestled between “HR” and “RBI” — a column labeled “TB.”

That’s right, total bases!
One of the enduring memories of my childhood dalliance with baseball was the mystique surrounding the 406 total bases that Jim Rice accumulated during his MVP season in 1978. It was the first time since Hank Aaron in 1959 that any player had surpassed the 400 mark, and it hadn’t been achieved in the American League since Joe DiMaggio in 1937.
After Rice, the next player to accomplish the feat was Larry Walker in 1997, long past my own collecting peak. We’re still waiting for the next American League member of the 400-TB club. (On a side note, shouldn’t the DH league be the one with more big-TB seasons?)
The p oint is, total bases were and are a big deal, and it must have been like a glass of cold water to the face to see TB pop up on Topps cards with no warning. The SLG calculation was, of course, greatly simplified:
SLG = TB/AB
Those 1971 Topps card backs were anomalies in other ways, too, most notably the inclusion of a black-and-white head shot at the expense of complete career statistics.
Whether due to collector outcry or just Topps’ stepping back from the ledge, both innovations — pictures and total bases — were gone from card backs in 1972, and SLG-seeking collectors were left to crank away on cumbersome calculations.
Slugging Percentage Takeout
Sudden rivalry can be an awesome agent for change, and that power was on full display in the stat lines on the backs of our baseball cards in 1981.
Facing full-force competition in the baseball card marketplace for the first time since 1955, Topps decided to shake up their formula after 10 years of stagnation. While the subdued design itself and the brown cardstock gave outward indications that 1981 Topps was just more of the same old TCG, an expanded statistical block gave numbers-oriented collectors a new thrill.
Among the additional columns included in every hitter’s statistical profile were strikeouts, walks, stolen bases, and (gasp!) slugging percentage.

For the first time ever, hobbyists could flip over their Topps baseball cards to find SLG and confirm (or refute) at a glance their general impression of a player’s power prowess.
Fleer turned in a good effort with their first full set and was prepared to overtake Topps in the statistical arena — the Philadelphia-based gum maker included strikeouts, walks, and stolen bases in their massive grids that showed full-career stats. Alas, they didn’t have the foresight to calculate slugging percentage, leaving Topps to cross the SLG finish line all alone.
In case you’re wondering, Donruss debuted with a relatively puny statistical profile that included only games, at-bats, runs, hits, double, triples, homers, RBI, and batting average for the 1980 season and for the player’s career.
Imperfect OBP
Although we now know that on-base percentage is likely more important to a team’s success than sl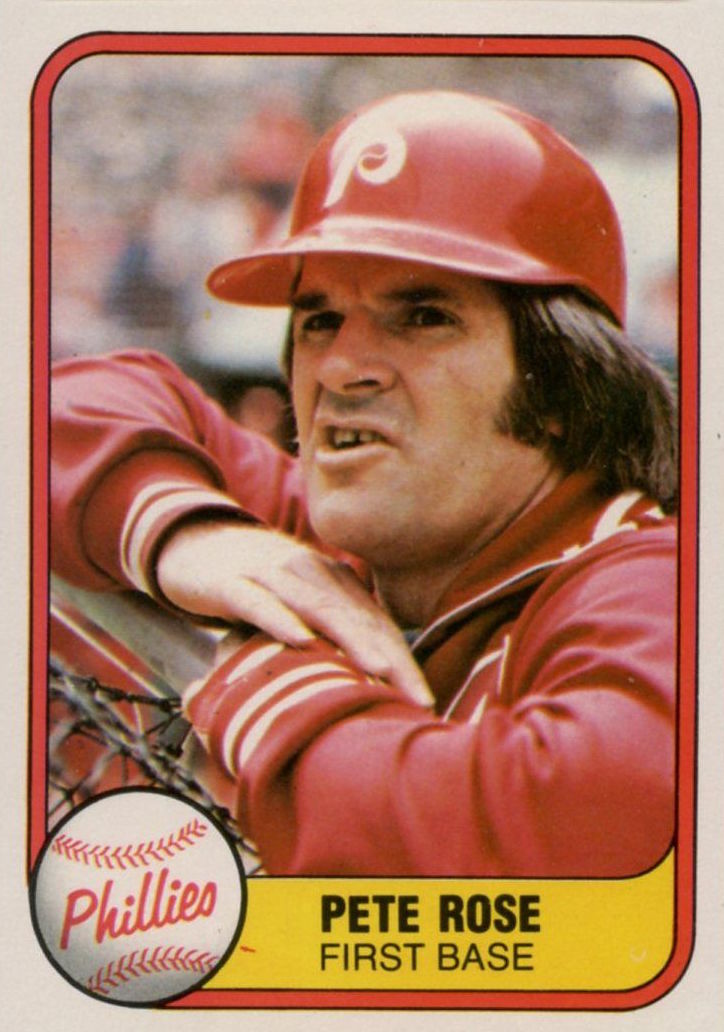 ugging percentage, collectors have spent most of cardboard history in the dark when it comes to gleaning OBP from our baseball cards.
The problem is that OBP is not quite as straightforward to calculate as is slugging percentage.
The real issue is that OBP involves some pretty obscure building blocks that just don’t make it onto our favorite swaths of cardboard. As a reminder …
OBP = (hits + walks + hit-by-pitch)/(at-bats + walks + hit-by-pitch + sacrifice flies)
You can see the difficulty here, as the only place to find HBP or SF information on baseball card backs is in the occasional blurb or cartoon.
The best collectors could do was to truncate the calculation to
OBP (approximate) = (hits + walks)/(at-bats + walks)
That approximation would get you pretty close to the mark for most players but would seriously shortchange the guys who were always game to take one for the team, like Don Baylor and Craig Biggio.
It would also reward the guys who collected a bunch of sacrifice flies, like Eddie Murray and Hank Aaron.
For instance, Baylor has a career OBP of .342, but if you ignore his 267 HBP and 115 sacrifice flies, that drops to .326. Meanwhile, Murray’s mark rises from .359 to .362 if you drop his 18 HBP and 128 sacrifice flies from consideration.
Someone like Dick Williams, who had modest totals of 12 HBP and 24 sac flies, is unaffected (.312 either way).
So, beginning in 1981, collectors could calculate this imperfect version of OBP if they were so inclined and, thus, they could also calculate an approximation of OPS for the first time:
OPS (approximate) = OBP (approximate) + SLG
And they could take their pick among Fleer or Topps to meet their (approximate) OPS goals.

Fleer to the Rescue
So the situation remained, all through the 1980s and into the heady hobby days of the early 1990s.
Cards got fancier, the number of manufacturers exploded, and chase cards with flashing lights and little bits of memorabilia or infield dirt or players’ teeth became the norm.
At the same time, fantasy baseball was gaining a strong foothold as the beginnings of the Internet made it possible for baseball nerds and statheads to connect like never before.
By 1995, Sandy Alderson and Billy Beane were beginning to apply statistical analysis in earnest to building their Oakland A’s into a contender despite tight budgetary constraints.
All the while, collectors were left to calculate their own on-base and slugging percentages from the other numbers on the backs of baseball cards (they could have sought out the help of The Baseball Encyclopedia or Total Baseball, of course, but you can’t stuff those into a plastic sleeve or your bike spokes).
Finally, Score delivered us from the OPS void in 1995 when their base set featured OBP on each batter’s stat line, slotted right next to its powerful brother, SLG.

After 46 years of waiting, modern collectors could, at last, calculate OPS from the information on a single baseball card and know how good their Waxpack Gods really were.
Score kept pumping out the Sabermetric goodness through the end of their run in 1998, with Fleer joining the OBP brigade in 1996.
Fleer expanded the use of OBP into several of their offerings, like Ultra and Tradition in the ensuing years, but other manufacturers were slow on the uptake.
By 2003, Fleer was still including OBP in some sets, but not others, and there were few if any other OBP sightings among the mountains of baseball cards issued each year. It seemed the golden era of OPS in our wax packs might be gone forever.
Note: This article originally credited 1996 Fleer with the first expicit appearance of OBP. Thanks to Twitter buddy @BallCardFacts for pointing out that Score scored first on this front:
1995 Score featured OB%. pic.twitter.com/QCbXCF8Spn
— Baseball Card Facts (@BallCardFacts) October 10, 2017
Topps Back on Top
But that wasn’t quite the end of the OPS-on-cardboard story.
Even though Topps is the oldest and, in many ways, most buttoned-down card company of them all, they are not above experimentation and innovation when it fits their vision of what makes for the best baseball card each season.
And, like they did in 1971, Topps apparently decided in 2004 that something completely out of the blue was in order.
In particular, Topps skipped right over on-base percentage and included OPS for the first time ever in their 2004 base set. But, unlike total bases 33 years earlier, OPS was here to stay.
Today, OPS is joined on the back of Topps hitter cards by everyone’s favorite Sabermetrics mark, WAR, which debuted in 2014.

(Wax) Wrapping It All Up
So, what’s the answer to our initial, burning question?
Which baseball card was the first to feature OPS as a statistic?
As with most things in life, it depends. But here are the candidates, depending on the level of rigor you want to employ:
- First appearance of components of slugging percentage: 1953 Topps Jackie Robinson (#1)
- First appearance of components of approximated on-base percentage: 1981 Fleer Pete Rose (#1)
- First appearance of components of approximated OPS: 1981 Fleer Pete Rose (#1)
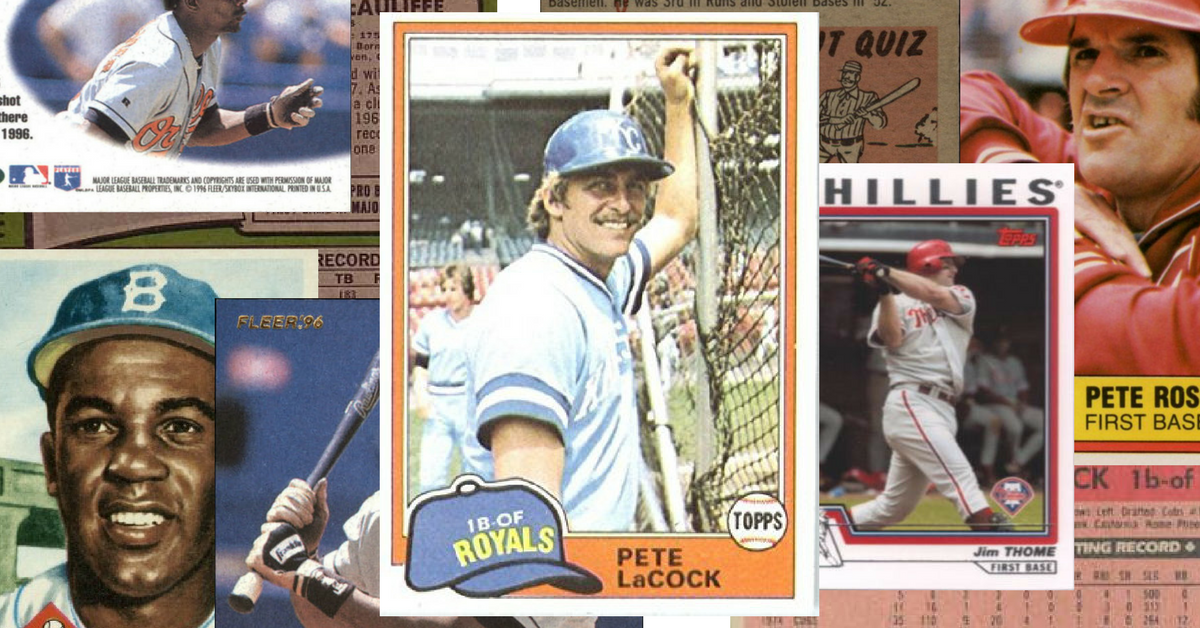
- First appearance of explicit slugging percentage: 1981 Topps Pete LaCock (#9)
- First appearance of explicit on-base percentage: 1995 Score Frank Thomas (#1)
- First appearance of both explicit components of actual OPS: 1995 Score Frank Thomas (#1)
- First explicit appearance of OPS: 2004 Topps Jim Thome (#1)
There is another slight nuance that we could add in, as the 1981 Topps Pete LaCock (#9) is also the first card to feature explicit SLG along with all the components necessary to calculate approximate on-base percentage.
(And “first” in any particular case above means the lowest-numbered card among sets which meet the given criteria. Thus, 1981 Fleer Pete Rose #1 beats out 1981 Topps Pete LaCock at #9 in a couple of situations.)
In the end, we really have two choices if we want to find the first baseball card that allows you to find a player’s true OPS — the 1995 Score Frank Thomas (#1) or the 2004 Topps Jim Thome (#1).
While the Thomas card is seven years older and would have brought me great joy as a child, I have to go with the Thome as the true first-OPS card.

And isn’t Thome a fitting choice for this “award” on our part and an almost prescient choice on the part of Topps?
After all, Popeye not only is a member of the exclusive 600-home-run club, but he stands 18th on the all-time OPS list with a .9560 mark (though four slots lower than the Big Hurt).
Those folks at Topps show some real promise, don’t they?
They just might have a future in this business.
(Check out our other baseball trivia posts here.)
Books About Sabermetrics at Amazon.com (affiliate link)
Books About Sabermetrics


1981 Topps Baseball Cards Complete Your Set U-Pick (#'s 201-400) Nm-Mint
 | $1.29 Buy it now | Add to watch list |
1981 Topps Baseball Cards Set of 17 Uncut-Squirt Exclusive Limited Edition
 | $50.00 Buy it now | Add to watch list |
1981 Topps baseball Cards starter set of 141 all different. Pete LaCock
 | $6.75 Buy it now | Add to watch list |
Lot Of 50 1981 Topps Baseball Cards - No Duplicates - Free Shipping
 | $15.00 Buy it now | Add to watch list |
1981 Topps Baseball Cards Complete Your Set U-Pick (#'s 1-200) Nm-Mint
 | $0.99 Buy it now | Add to watch list |
1981 Topps Baseball Cards Complete Your Set U-Pick (#'s 601-726) Nm-Mint
 | $0.99 Buy it now | Add to watch list |
1981 Topps Baseball Cards #'s 1-250 NMMT You Pick + Free Shipping!
 | $1.00 Buy it now | Add to watch list |
1981 Topps Baseball Cards Complete Your Set U-Pick (#'s 401-600) Nm-Mint
 | $1.09 Buy it now | Add to watch list |


Recent Comments